


In this tutorial, I’ll explain to you how to trade with support and resistance: how to develop effective strategies, place take profit and stop loss levels using this indicator.
As I mentioned in my previous post about reading Japanese candlestick charts, using the basic technical analysis tools is no rocket science. In this post, I write about a next one – how to read a horizontal line on the chart, that is how to trade with support and resistance.
[button link=”https://app.simplefx.com/login” size=”medium” target=”new” text_color=”#eeeeee” color=”#3cc195″]Check out the best trading app![/button]
The market is driven by emotions. Traders are seeing equity or currency being overpriced or underpriced and react to it. The patterns are present in the markets because they are natural tendencies of our mind.
Support and resistance are the most basic patterns. Let's say the price of a stock goes up. The company has revealed fantastic financial results and it turned out they have a bright future. The stock climbs on and on until it reaches a well-rounded sum, let's say $100. This alone is enough for many to start thinking it's overpriced. “Come on, I'd never pay a three-digit price for this” – believe it or not, this is how it works.
The market notices an overpricing or underpricing and reacts.
Waiting or predicting what will happen
There are two main strategies we can use. If we think support or resistance level is going to hold we can first of all wait for confirmation or we can try to guess whether the price will bounce off the support or resistance or break through it.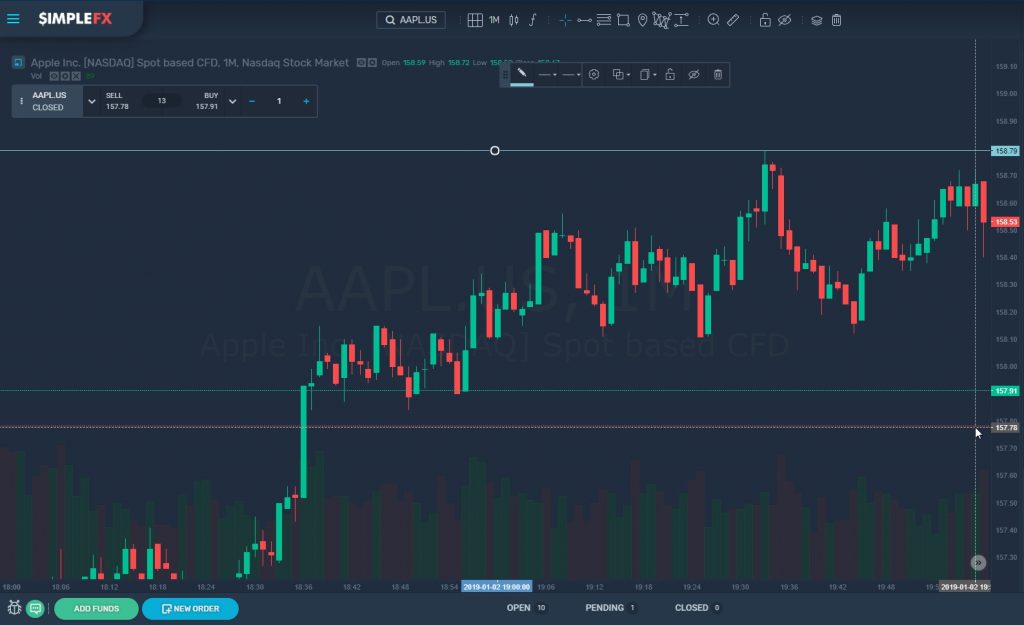

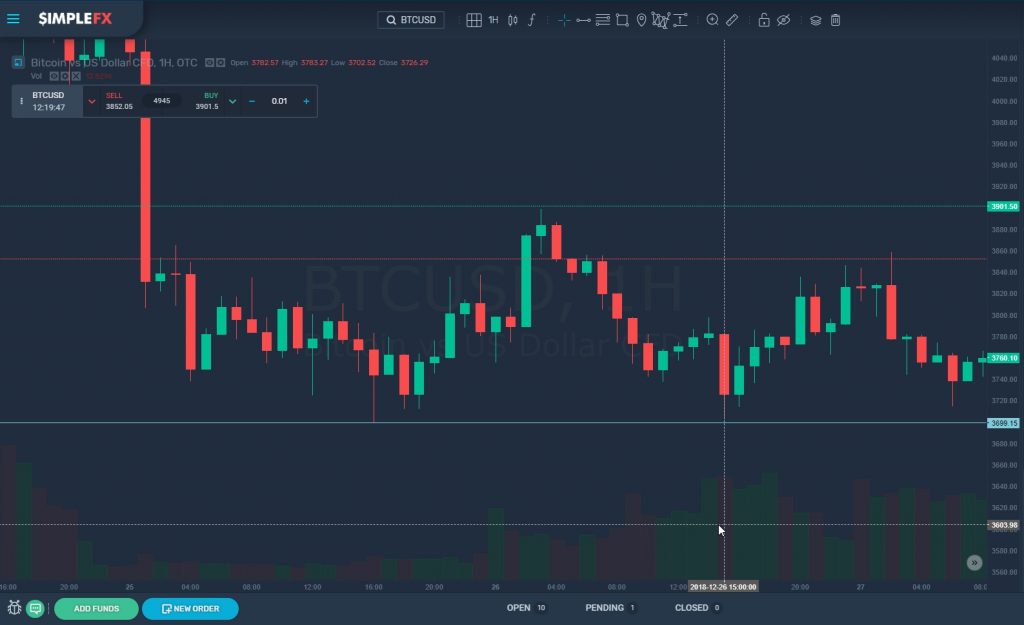
Here’s an example. This is a 1-hour BTCUSD chart. We want to take a long position at the hour marked with the vertical line. We have drawn a horizontal line that we believe is a support level at $3699. The market goes down then it rallies, and then a big red candlestick barely touches our line. We have two options:
- We can place an order at 15:00 guessing that the market will go up in the next hour
- We can wait for a confirmation
Waiting for a confirmation
Now let’s take a look at a reverse example. This time we are considering taking a short position on the Apple stock at the time marked with the vertical line. We set the resistance level at $158.79. There are two green candles approaching the level, but we want confirmation. The first red candle could be enough, but the second is even a stronger sign of a trend reversal.
I open a short order in the minute marked with the last red bar and set a stop loss at slightly above the resistance level, let’s say $158.90. Let’s take a look at what happened next.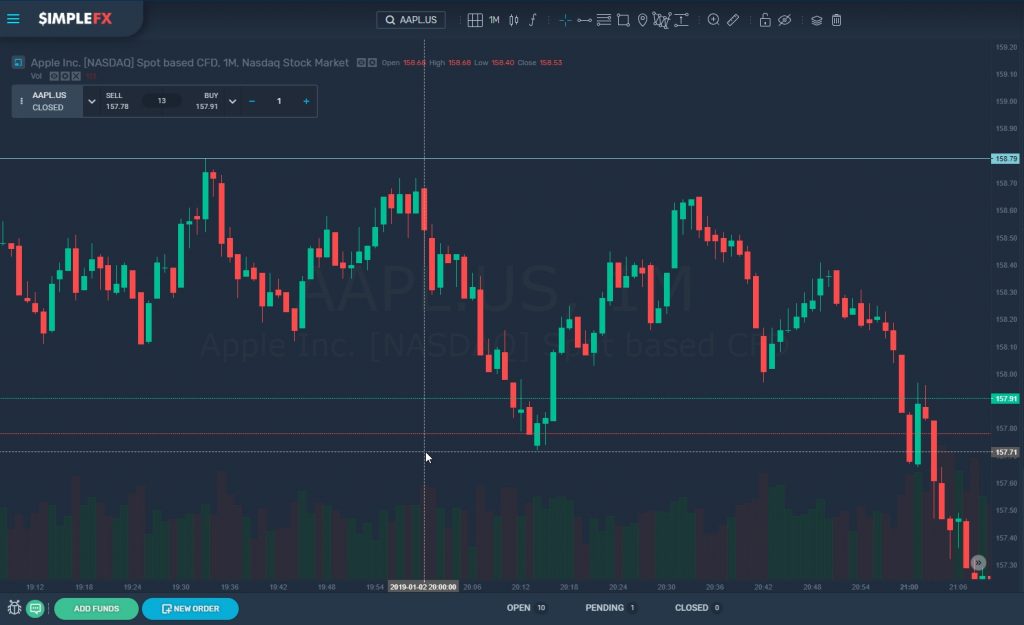
The point at which I open my short position is marked with the mouse cursor and the vertical line. I made a safe rational decision that turned out to be a nice trade if I set take profit at around $157.71, but if I played more aggressively it gave me much bigger profit as the market fell one dollar further before going up.
Anticipating the support and resistance
This is a strategy for more advanced traders willing to take more risk in order to maximize the profit. Guessing you don’t wait for a confirmation, but make an order when the market approaches the support or resistance level without any other signs of it bouncing.
Let’s take a look at the same BTCUSD example.
Instead of waiting for the green candlestick confirmation we could have opened the buy order at the moment we see the red candlestick approaching our support level. It was riskier, but we would have bought the Bitcoins $27 cheaper.
Now let’s take a look at a more negative example where greed and impatience blow a trade up.
Here’s a 15-minutes EURUSD chart. My trading strategy involves what seems to be strong support at $1.14209.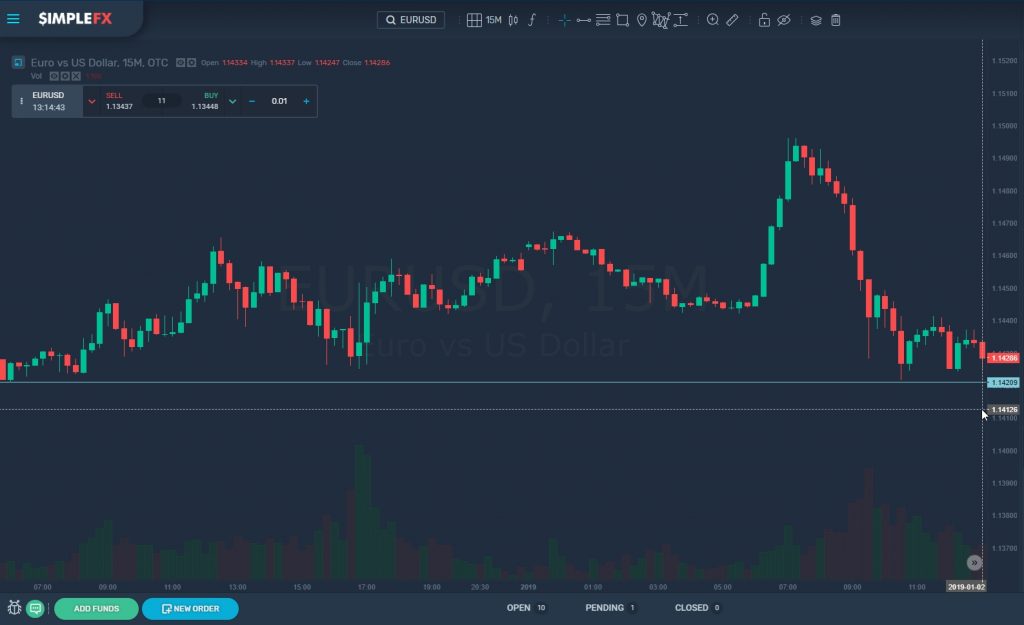
I can see the chart approaching it two times recently, and I want to go in for a long position with the third one without any confirmations. I trust my guts and place an order at $1.1426. Let’s see what happened next.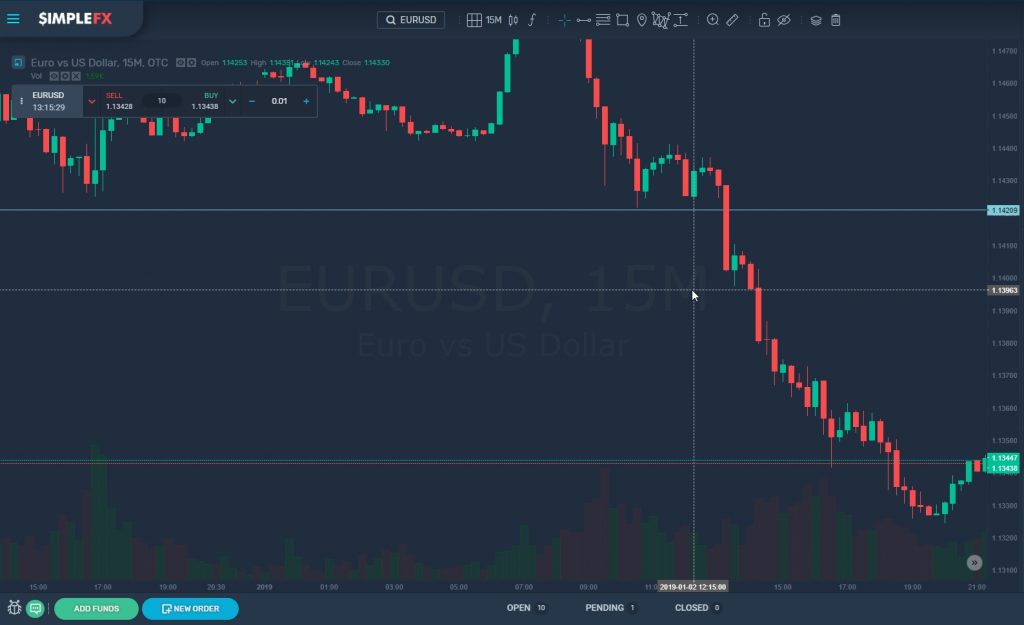
Unfortunately for me, the support was broken in the next 15 minutes, and I would lose a lot not placing any stop loss levels.
You can see one of the drawbacks of trying to anticipate the trend and give up further confirmation.
I would advise beginner traders to wait for confirmation even only to practice good habits of discipline, patience – which are very important for any trader.


