This weekend we recommend taking a closer look at the oil prices as well as the Japanese yen on the Forex market. Both symbols are going through an interesting period, which may be defining the future trend in the upcoming days.

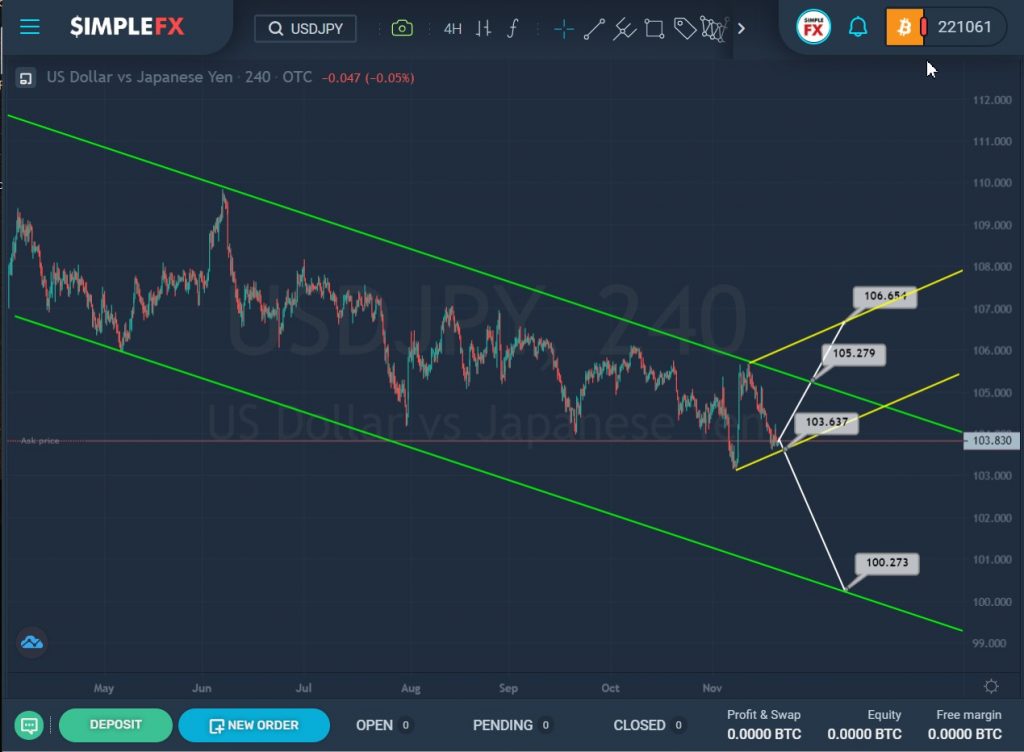
The USDJPY structure shows the descending trend inside the green channel.
For a long time, the price moved along the center of the channel without touching the lower and upper walls. But recently, the market reached the upper green line, but without breaking it, it went down again.
It is possible that the bulls will try to push the price up again, and if they manage to reach the resistance level of 105.27, located on the upper green line, and then break through it, then we could see a continuation of the price increase to the upper line of the small yellow channel and the resistance level of 106.65.
In the second case, the price is expected to fall. If the currency pair breaks the target level of 103.63, which is on the lower yellow line, then the bears will open the way to the lower green wall and the next support level of 100.27.

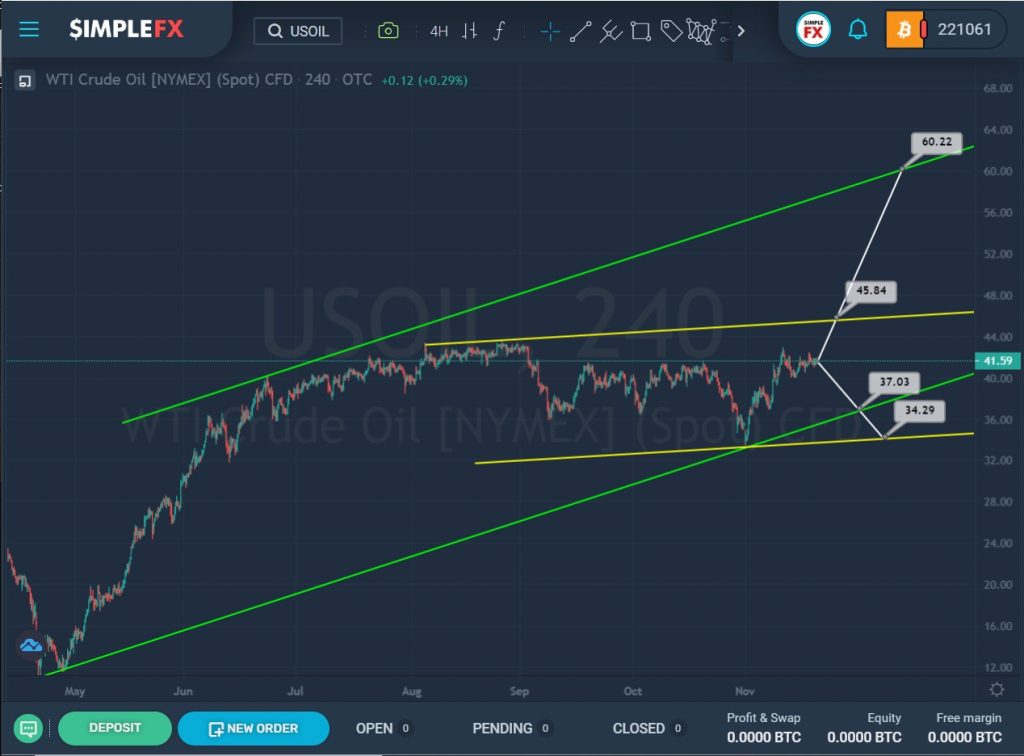
The USOIL structure shows a bullish trend that moves within the green channel.
After rebounding from the upper green wall, the price began to gradually fall to the lower line of this channel and then pushed off from it.
More precisely, the price behavior in the last section of the chart is described by a small yellow channel.
Now the market is in the upper area of this channel, so maybe the price increase will continue in the direction of the top yellow wall and the resistance level of 45.84. If the bulls can break through this mark, the path to the upper green line and the resistance level of 60.22 will open for oil.
However, if the bears can take control of the market and send the price to the lower green line and the support level of 37.03, then, in the event of a break of this level, we can expect a continuation of the downward movement of the price to the lower yellow line and the level of 34.29.

