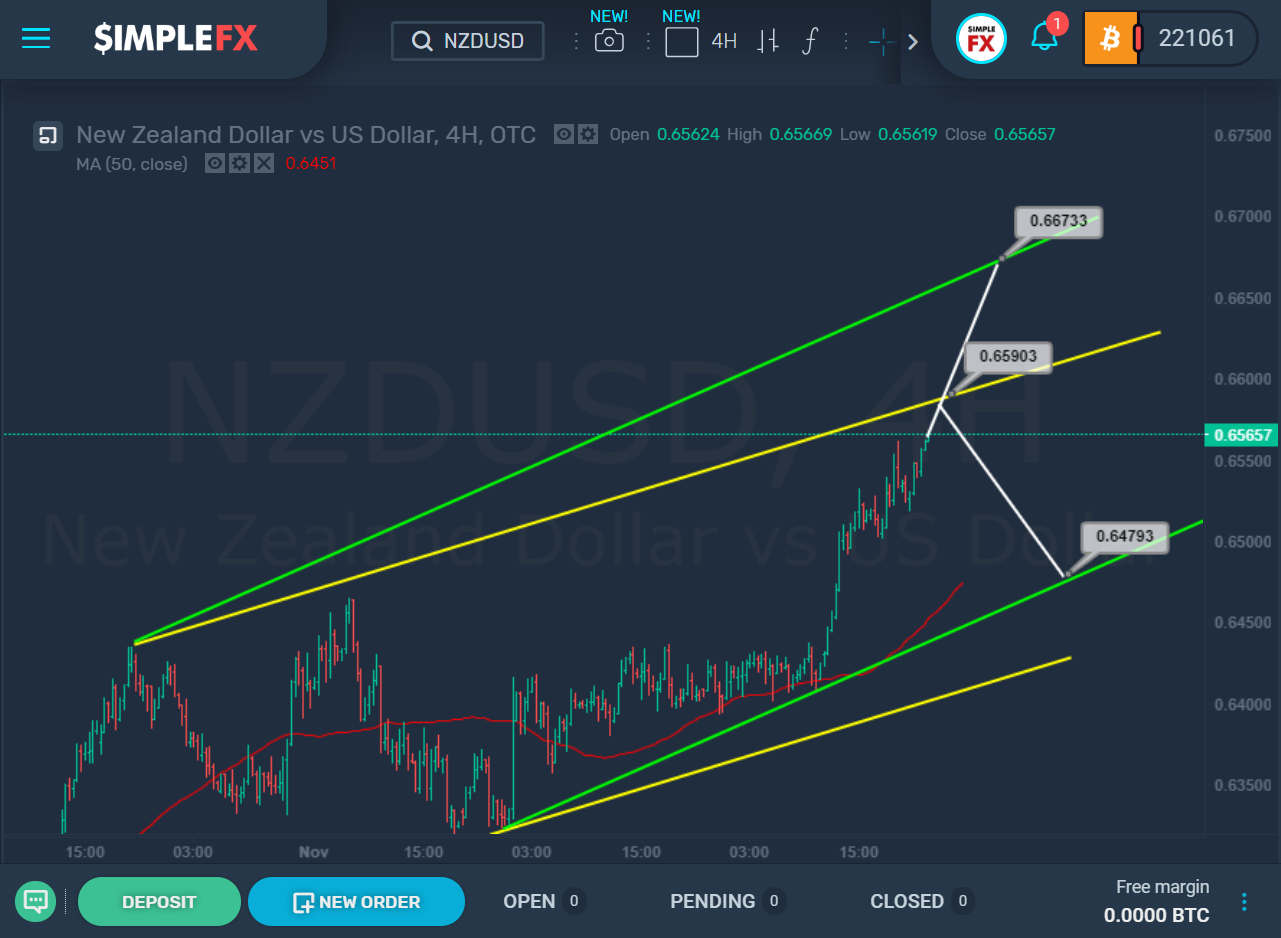
 We see price movement within the green and yellow channels. It is likely that the market is now approaching the upper bound of the yellow channel and the resistance level of 0.659.
If we see a break above 0.659, the way to the upper wall of the green channel and the next significant resistance level of 0.667 may open for the bulls. The probability of price movement in this scenario is high because the bulls have accumulated a lot of energy moving in the flat during the previous trading weeks.
However, if we see a rebound from 0.659, in this case, the price can expect a decline to the lower green wall and the support level of 0.647. The approximate scheme of possible scenarios of price movement is indicated on the chart.
