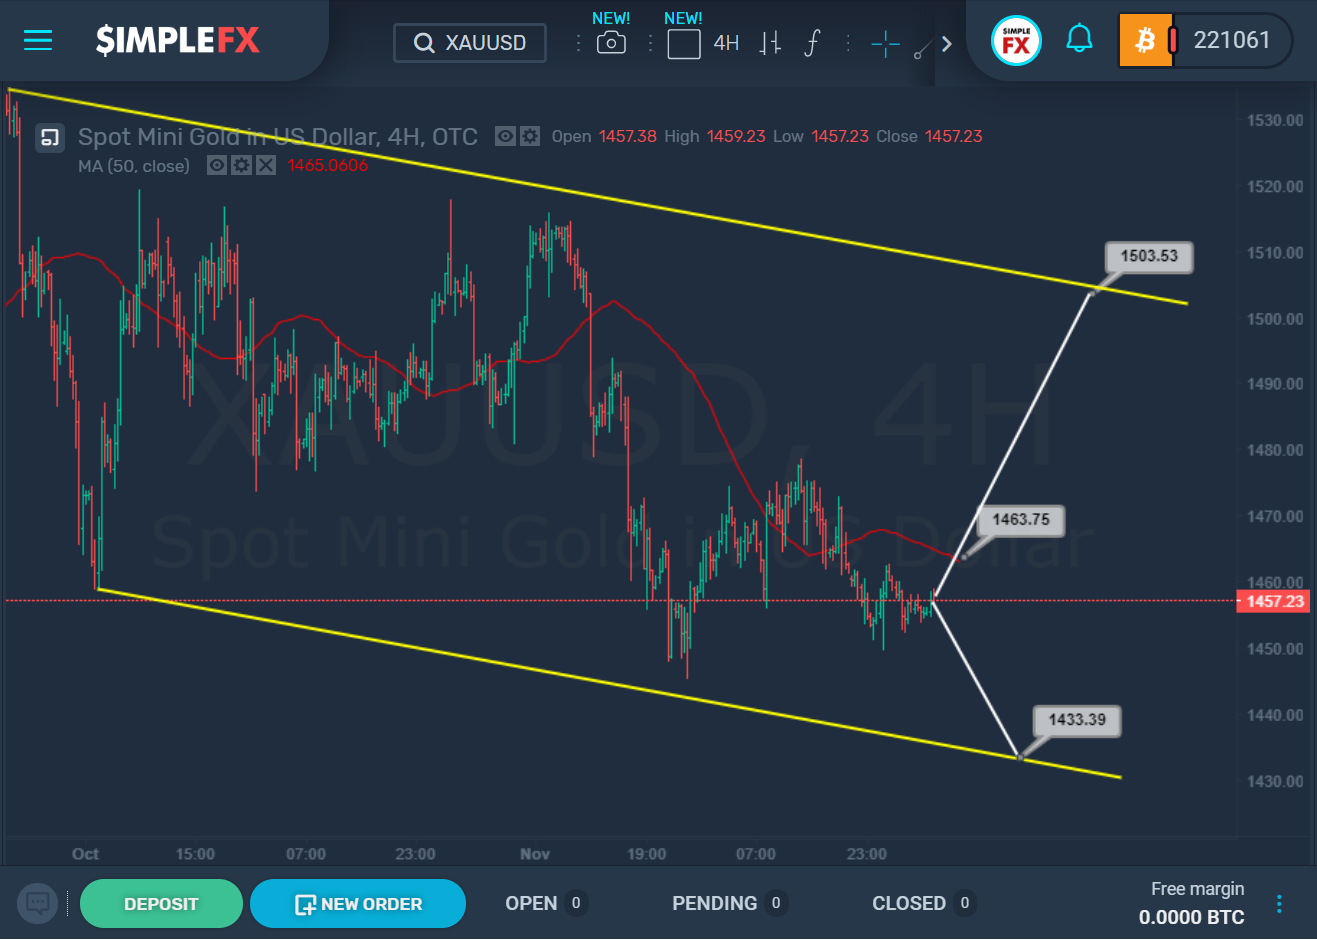
 The price movement during the previous few trading weeks can be described by the bounds of the descending yellow channel. Not so long ago, we saw a rebound from the lower wall of this channel, after which the market moved up a little, and then the bears again began to pull the price down.
[button link=”https://app.simplefx.com/login” size=”medium” target=”new” text_color=”#eeeeee” color=”#df4444″]SELL Gold[/button] [button link=”https://app.simplefx.com/login” size=”medium” target=”new” text_color=”#eeeeee” color=”#3cc195″]BUY Gold[/button]
It is not clear what the scenario will choose the price. Either we will see a continuation of the decline to the support level of 1433.39, or we can expect the market to grow to the level of 1503.53, which is on the upper wall of the yellow channel.
The path to the resistance level of 1503.53 may be opened when the red line of the moving average breaks near 1463.75. The approximate scheme of possible movement options is indicated on the chart.

