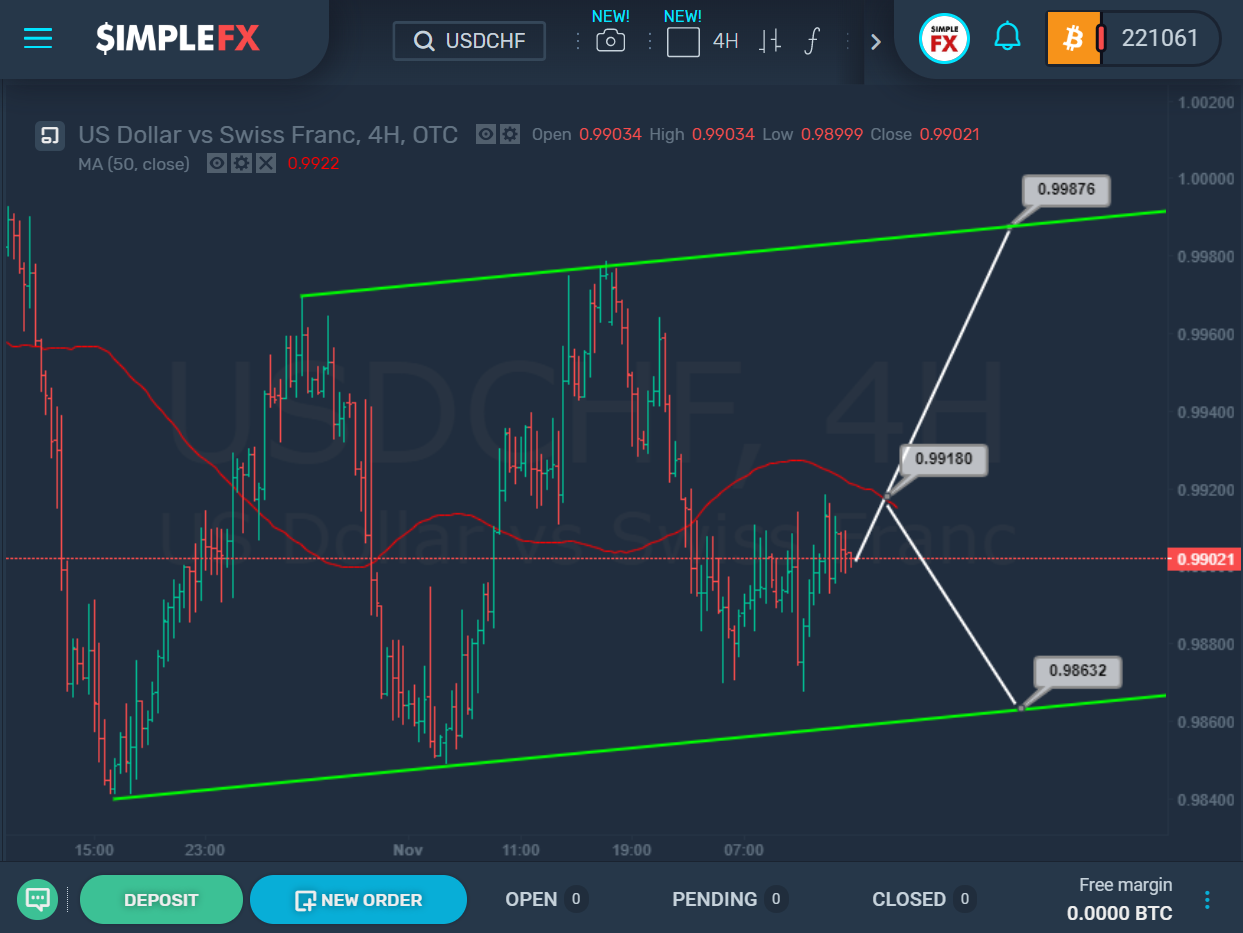
 At the moment, the market is in the lower zone of the green ascending channel. Approximately in the center of this channel is the red line of the moving average, which is the resistance line for the price. Whether the bulls or bears win depends on whether the price crosses this line or not.
If we see a break above the resistance level near 0.991, the growth may continue to the upper bound of the green channel and the resistance level of 0.998. However, if the price does not go above the moving average, and the market either immediately goes down or pushes away from the resistance of 0.991, in this case, we can expect a decline to the lower bound of the green channel and the support level of 0.986.
The chart provides a schematic view of the market movement.
