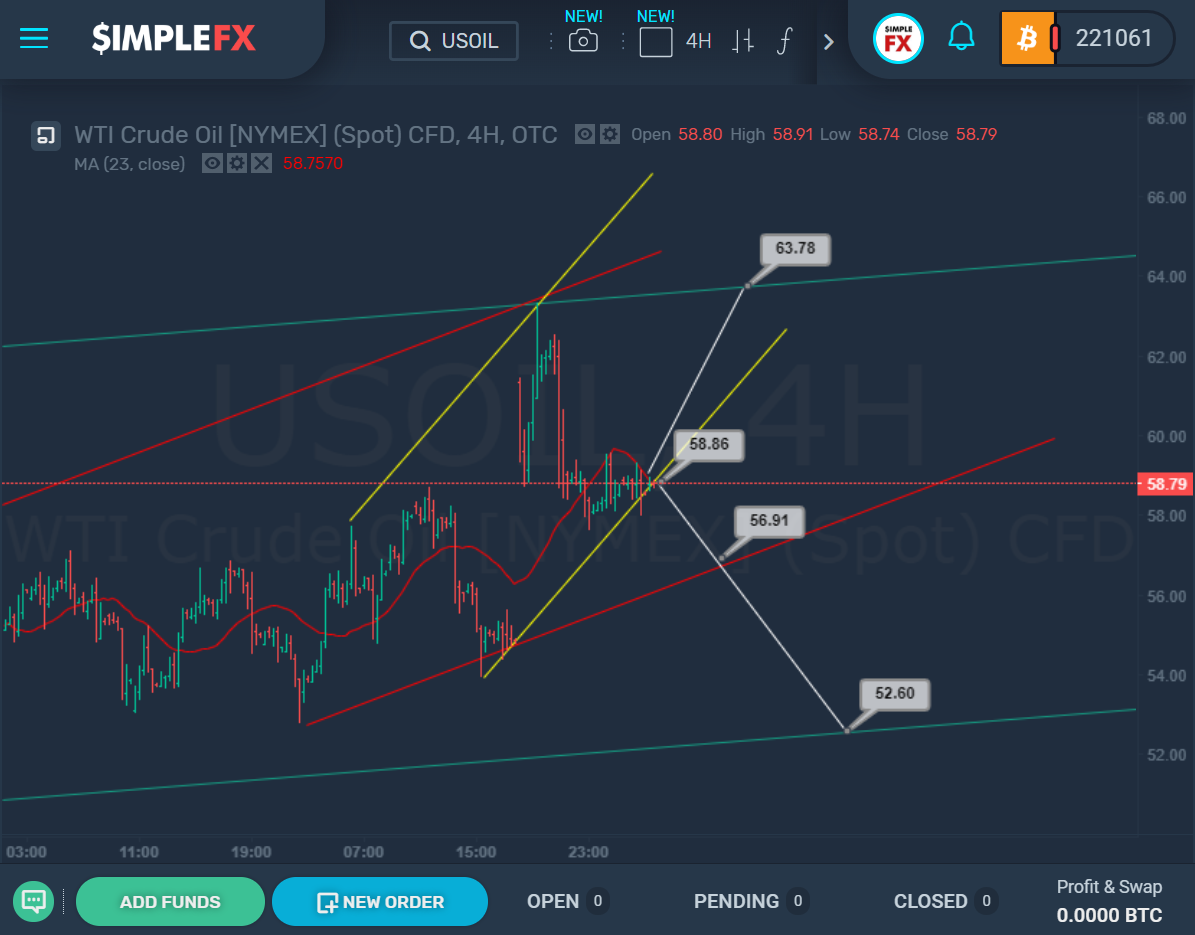
The chart shows three channels that affect price behavior. Given that the upper boundaries of the red and green channels were previously reached, we can now see a decline aimed at reaching the lower bounds of these channels. At the moment, the price is near the yellow support line. If the bears can break through the support of 58.53, which is located on the lower yellow bound, then they will open the way in the direction of the red bound and the support level of 56.91. If we see a rebound from the yellow wall, the bulls can take control of the price movement, which can raise the price to the level of 63.78, located on the upper green bound.
