Here’s the next episode of SimpleFX Trading Academy tutorials for beginner traders. We told you already:
- How to Trade Cryptocurrencies, Forex or Stock on Mobile Devices
- How to Browse Trading Ideas and Follow Your Favorite Authors
- How to read the Japanese Candlestick Charts and how to spot the basic reversal patterns
- Learn how to use Fibonacci Retracement Tool to day trade during the Crypto Crash (or Recovery)!
- How to Trade Market Sentiment
- How to Recognize False Breakouts
- Trading with support and resistance on SimpleFX
If you haven’t read the previous chart trading tutorials, please take a look at least at the last one about trading support and resistance. If you learn to recognize the basic price patterns, it will be much easier for you to make money and to understand why you are losing it.
Of course, the signals you (and all other experienced trades) learn to recognize in practice can go the other way. It’s a question of probability. If you are confident in your chart signals interpretation, you will be able to see when something extraordinary happens. Especially cryptocurrencies, but the most traded Forex pairs as well, are exposed to market manipulation.
You could see it at the beginning of April when allegedly $100,000,000 was enough to move the largest cryptocurrency 20% up, and start a bullish trend on Bitcoin and other altcoins. Most of the times you won’t be able to read this kind of events from the chart. The big actors who want to make money include the basic patterns into their scheme of playing the small traders.
This is just another reason why you have to know the basic patterns. Don’t miss today’s lesson where I’ll write about a pretty straightforward double top formation and double bottom formation.
Double tops and double bottoms are variations to support and resistance trading. They are technical analysis ABC, simple patterns to spot.
Recognizing a double top pattern
This trading formation occurs when the market is trending up. As always during a bullish trend, you get retracements (temporary price declines when some of the investors sell their assets to make a profit) after which the market should go to the new heights.
However, if the retracement happens before breaking the old resistance level, this may be the beginning of a double top chart pattern.
Take a look at the example below. Here’s a GBPCHF price action on a 5-minute chart.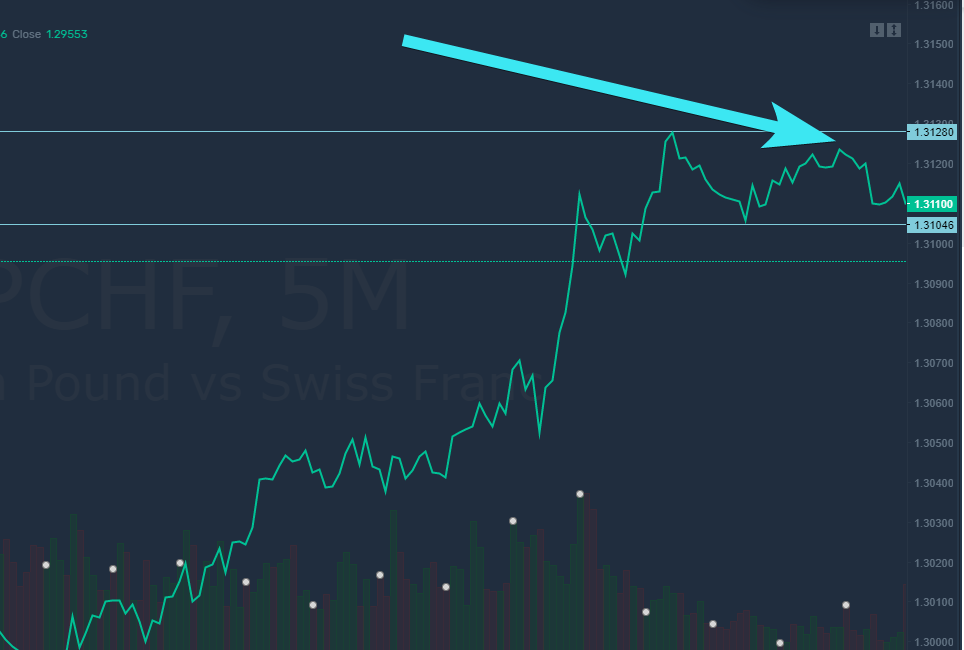
As you can see, the price moves down once again before reaching the previous hights. At this point, you may suspect a double top, but if you don’t want to take too much risk (which may be a good strategy for beginners), you could wait for a confirmation.
In this case, it does come when the price breaks through the local support level. The double top pattern showed up, and I place an order assuming that the price will go down at least the amount equal to the difference between the local high and low market by my horizontal lines. I’ll go by the book and make a SELL order here.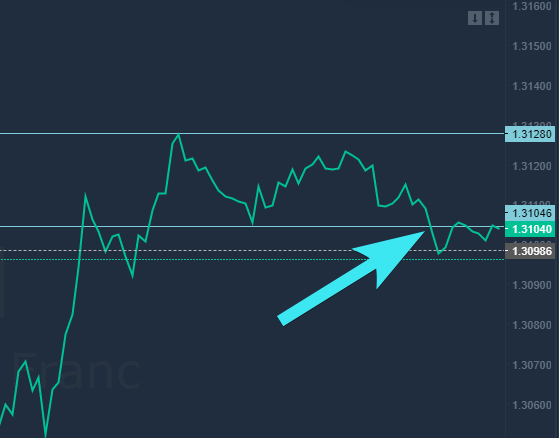
Let’s take a look if it worked for me here…
It did. Not only the price dropped substantially during the next two and a half hours, but also the pattern helped me predict a trend reversal.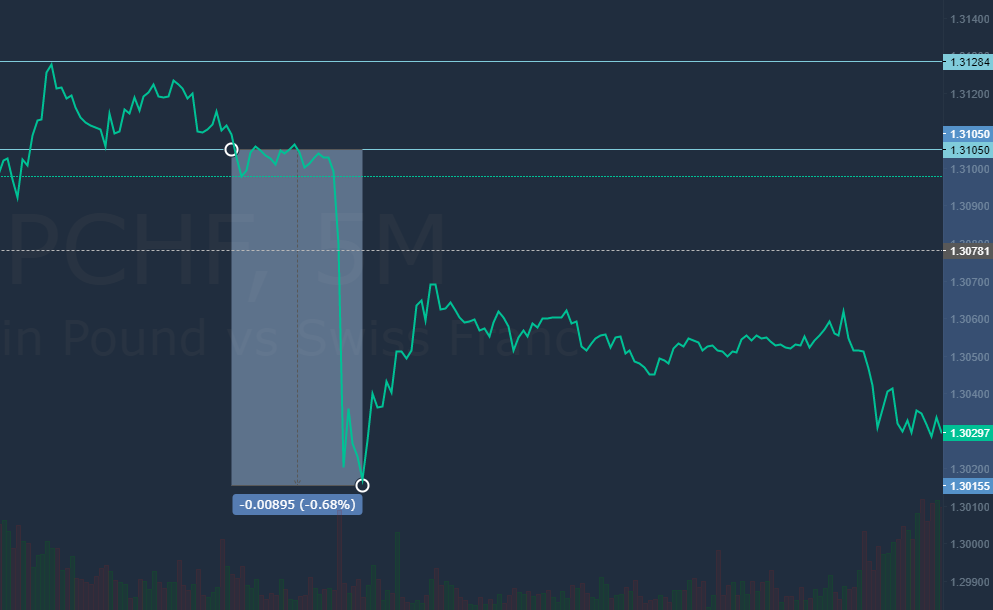
In this case, the double top formation and the confirmation of the pattern proved to be a clear signal and used created an attractive opportunity for profit.
Taking advantage of a double bottom chart pattern
Since the double bottom formation is just a mirror reflection of a double top one, to make things more attractive, let’s take a look at the stock chart and use candlesticks this time.
Let’s take a look at a pattern on the chart of Tilray Inc., a popular among SimpleFX traders stock on the Nasdaq. Once again I chose the same timeframe, where each candle represents five minutes worth of trading.
At the moment shown below, we are in a downtrend. Some retracements happen, then we have a rally that starts above the last support level. This may be a sign of trend reversal.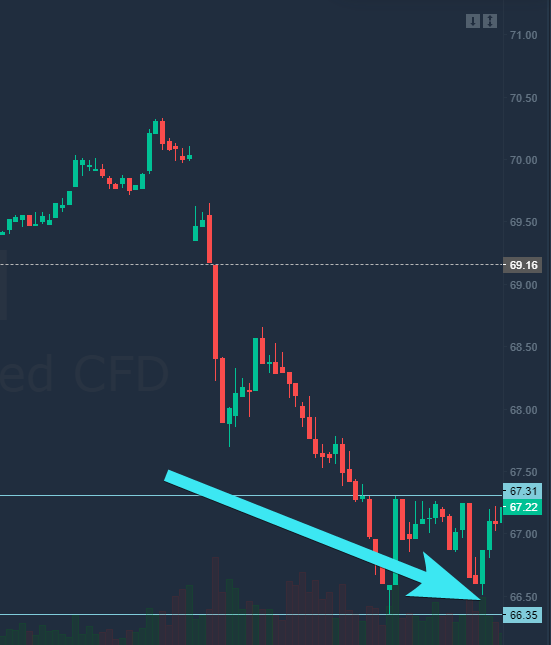
Once again, let’s wait for confirmation. Will the rally break the local resistance line? We may open a BUY order now, but it’s much safer to wait for a confirmation.
Let’s see, what happens next.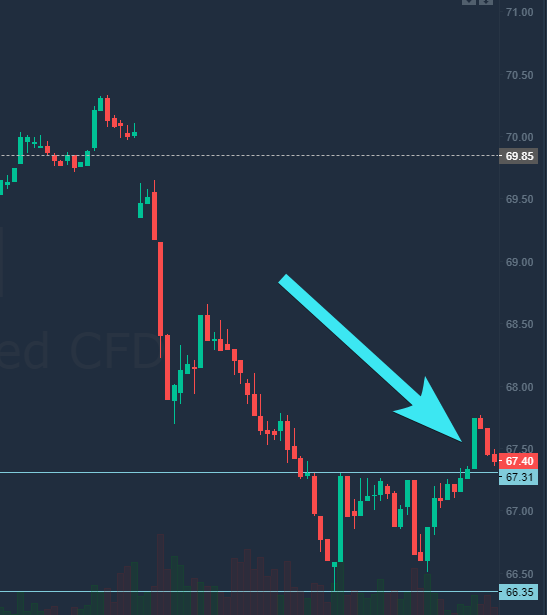
The chart broke the resistance. I decide to open a long position assuming that the price will go up at least the difference market by the two horizontal lines.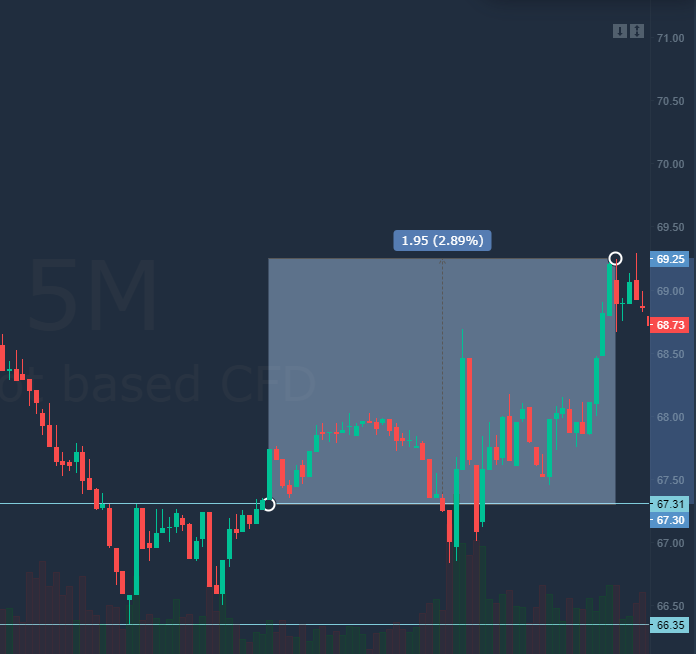
This time it worked, too. In the next period, I managed to make a 2,89% profit, before closing my position.
Of course, these are just examples, and you may point to many historical examples where the pattern didn’t work. It’s always the case when trading the patterns. You need to be aware that other traders use them, but also bear in mind that big influential players may want to act against them.
As usual, the devil is in the details. When trading chart patterns, it’s crucial to adjust your stop loss levels accordingly. In the Tilray example above I set it at the lower support level, had I done it tighter, I would have been knocked out of my position during the “third bottom.” On the other hand, placing it that low made a possible loss bigger, and if I applied maximum leverage, this could mean a substantial risk.
Give the double top and double bottom pattern a try. See how it works on your favorite instruments. Try tempering with different stop loss and take profit levels, and develop a successful trading strategy. Good luck.

